
Red vs Blue
Who wins in the age old battle two player battle? Let's investigate.Economic Rivalries
A simple monetary showdown. Market capitalization is used otherwise noted.
Victory percentage is calculated as abs(V1 - V2) / (V1 + V2)
The most interensting thing here is the graphical similarities between competitors in the same field.
Victory percentage is calculated as abs(V1 - V2) / (V1 + V2)
| Red | Winner | Blue | Fun Facts |
 |
15% |  |
Is Pepsi ok? |
 |
13% |  |
The stock symbol for AT&T is just T because early stock tickers interpreted an ampersand as a new line character1 |
 |
45% |  |
The merger of Sega and Sammy prevented this from being a total massacre. |
 |
72% |  |
I prefer the iconography of the old Walmart logo. |
 |
96% |  |
A bit of a stretch since ATI was acquired by AMD (which competes more directly with Intel on processors) and AMD is green. |
 |
76% |  |
Both logos are composed of three separate segments. Perhaps to work better as a light up sign. Albertsons is privately held. Valuation based on revenue. |
 |
42% |  |
... |
 |
??? |  |
Not sure how to value these since they are both owned by gigantic parent companies. I've seen $5.6B in sales quoted for Marvel licensed properties, but I can't find comparable numbers for DC Entertainment. |
 |
84% |  |
Speed stripes make your shoes go faster? New Balance is privately held. Revenue used for valuation. |
 |
35% |  |
Artsy circles for all your firearm needs. |
 |
0.4% |  |
Folded rectangles = Bank? |
 |
56% |  |
Both companies recently switched to spherical logos. |
 |
44% |  |
... |
 |
38% |  |
... |
 |
35% |  |
The world of paint. Discovered while writing the cars section below. |
 |
80% |  |
Calculated on per capita GDP (PPP) in 1990. |
 |
??? |  |
Pizza Hut is owned by YUM! Brands, their 2014 annual report is 172 pages long and questionably organized. I have no idea how to determine Pizza Hut specific revenue. |
| Totals: | |
| Red: | 330 |
| Blue: | 401 |
The most interensting thing here is the graphical similarities between competitors in the same field.
Ideological Battles
| Red | Winner | Blue | Notes |
 |
36% |  |
Google's numbers include at least 40 million users coerced or tricked into creating a Google plus account via youtube. |
 |
37% |  |
63% of European Jews and 100% of Hitlers killed. You can't win until the last lap. |
 |
??? |  |
Senate: 45 vs 53,
House: 231 vs 200 Plus god knows how many state and local positions. See Alien vs Predator tagline. |
 |
42% |  |
Earth invasions of mars have met with limited success, but there has been no meaningful counter-attack. |
 |
8% |  |
Whoever wins... we lose. Scored by kill counts in this video |
 |
11% |  |
Google search results (with top images used for icons). |
 |
23% |  |
Bing search results (with top images used for icons). |
 |
100% |  |
The blu-ray logo looks like somebody stepped on it. |
| Totals: | |
| Red: | 31 |
| Blue: | 226 |
The russian word for "red" can also mean wonderful/amazing2. America likes to call themselves the blue team, friendly fire is known as blue on blue, and we have idioms like "true blue". In Japan, "love" and "blue" are homonyms3. Perhaps this is why we get along great with Japan but still have the occasional dust-up with Russia?
Video Games
Team Fortress 2
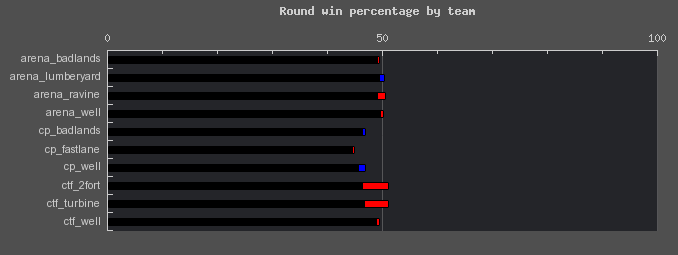 Some time ago, Valve released a graph of win/loss statistics for Team Fortress 2. Shown here is that graph reduced to only the symmetrical maps, folded over to show the win/loss delta while ignoring tie games. The sample size is huge - hundreds of thousands of games - so the advantage to the red team on certain maps is very real and unexplained.
Some time ago, Valve released a graph of win/loss statistics for Team Fortress 2. Shown here is that graph reduced to only the symmetrical maps, folded over to show the win/loss delta while ignoring tie games. The sample size is huge - hundreds of thousands of games - so the advantage to the red team on certain maps is very real and unexplained.
Hypotheses
- Red is team 0. Players that load the game first will be assigned to team zero first. Skilled players are more likely to invest in a high end computer that will load faster and thus are more likely to be assigned to the red team.
- Skilled players are more likely to click wildly on the first thing available to get the game started - the first team option.
- Skilled players, looking for every edge they can get, read a bunch of articles on the internet about how wearing red makes you better at things. It becomes a self-fulfilling prophecy when all players concerned about doing well join the red team.
- Skilled players like red for whatever reason.
- Wearing red makes you better at games, even though you can only see your own body when you die.
Sports
Bullshit
There's like a million bullshit articles on the internet about what wearing red or seeing red does to you. They all cite other bullshit articles and there's no bottom.
NFL, MLB, NBA
I would like to create a scatter plot of win loss records vs uniform or logo hue. This is somewhat complicated.
Uniforms have changed over the years, and while life time win/loss statistics are available for teams, sorting out what years they had what uniforms involves historical research. Uniforms have multiple colors, sometimes more than five on a single uniform. There are separate home, away, and alternate uniforms. Black, white, and gray are common colors for the whole uniform, with just a colored logo or stripe. Does a yellow stripe count as 'red'? What about an orange logo on a black field? Are strong logo colors more important than uniform colors? Hyperdimensional analysis is required.
UFC
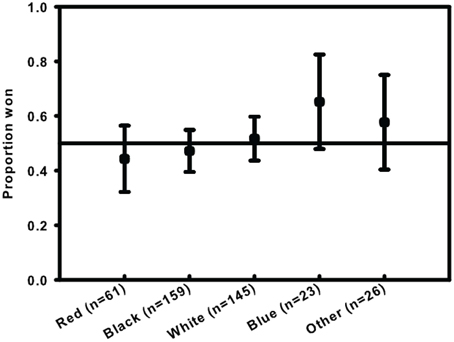
In addition to different colored trunks for each fighter, UFC matches have a red corner and a blue corner and each fighters gloves are taped with their respective corner color. The favorite fighter (or champion) is introduced second and is assigned to the red corner, which will probably heavily skew the results - but there seems to be no resource for corner color victories.
One study concludes that trunk color has no effect. Although looking at the graph with my limited understanding, blue seems to come out ahead.
Joining team red mid way through the fight is always an option.
There's like a million bullshit articles on the internet about what wearing red or seeing red does to you. They all cite other bullshit articles and there's no bottom.
NFL, MLB, NBA
I would like to create a scatter plot of win loss records vs uniform or logo hue. This is somewhat complicated.
Uniforms have changed over the years, and while life time win/loss statistics are available for teams, sorting out what years they had what uniforms involves historical research. Uniforms have multiple colors, sometimes more than five on a single uniform. There are separate home, away, and alternate uniforms. Black, white, and gray are common colors for the whole uniform, with just a colored logo or stripe. Does a yellow stripe count as 'red'? What about an orange logo on a black field? Are strong logo colors more important than uniform colors? Hyperdimensional analysis is required.
UFC
Blue trunks are better?
One study concludes that trunk color has no effect. Although looking at the graph with my limited understanding, blue seems to come out ahead.
Joining team red mid way through the fight is always an option.
Pasta
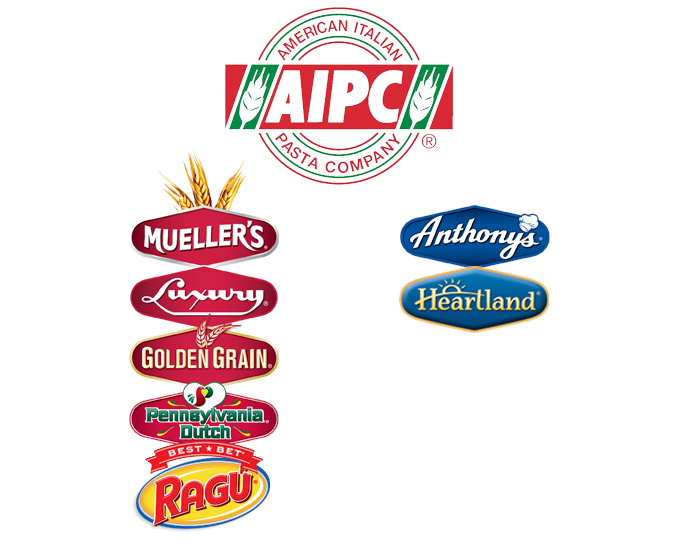
 Here we see that San Giorgio and Ronzoni brand pastas use the same ad copy on their boxes. That's because they are both owned by the some company - the ominously named New World Pasta.
AIPC owns 6 reds and 2 blues:
War
Surely there are many incidents of armies meeting with red and blue flags or uniforms. Wikipedia has a pretty good list of wars, but flags are complicated and there is often more than one party on each side. A script could be written to collect all the flag and casualty data from the wiki, then generate a color histogram of all the flags involved on each side (this can be done with imagemagick), choose the dominant color of each side, then graph hue delta vs casualty percentage delta.
Red vs Blue
Relevant wikis do not seem to conveniently list all deaths in the series. The only way forward seems to be to carefully watch all 250+ episodes.
At one point it is revealed that red and blue are the same team (just like pasta!), or at least have the same tech support guy. I can't find the clip :(
Cars
Tickets
According to snopes, red cars do not get more speeding tickets.
Accidents
There seems to be a lot of anectodal evidence about gray cars getting hit more because people don't see them. Actual facts are hard to come by.
Theft
Again, there is a dearth of facts and a glut of bullshit clickbait tabloid articles.
Color Preference
Here we have some numbers, because you gotta sell paint.
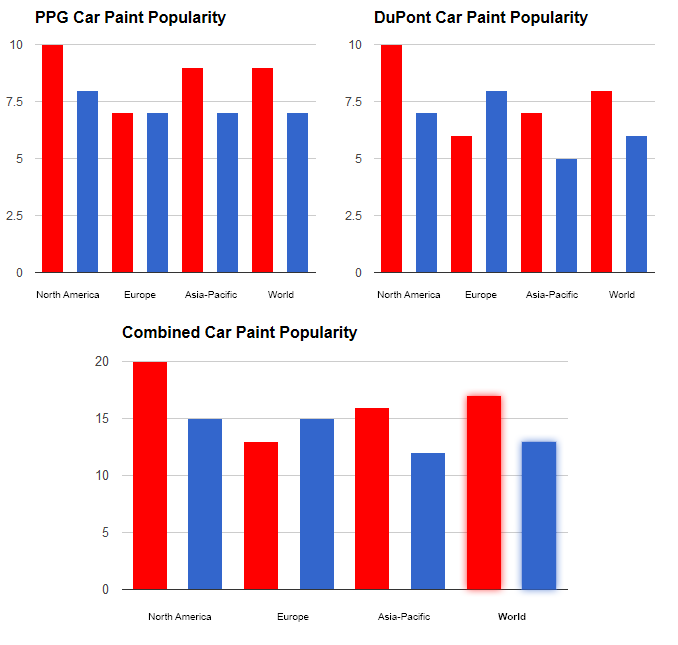
Wait a minute, what color logos do PPG and DuPont use? Well there's another one to add.
Pokemon
Pokemon games are released in pairs. The idea being to encourage players to buy the same dumb game twice trade unique pokemon with friends who have a different version of the game.
Red and blue have squared off three times:
Sales numbers seem to only be released for the combined pairs, not individual games. There may be some proxy numbers such as used game sales available somewhere.
In the original gameboy games, your character's default name is "Red" and your rival's default name is "Blue" - was the rival's name "Green" in Japan? Japanese for blue, "Ai", is a girl's name. If you bought Pokemon Blue was your name still "Red"? I should mention at this point that I've never actually played pokemon.
Red and blue have squared off three times:
 |
? |  |
Originally released in Japan as Red and Green, but then a Blue version was also released in Japan. It's confusing. |
 |
? |  |
... |
 |
? |  |
Ruby and Sapphire remade for the 3DS game system. |
Sales numbers seem to only be released for the combined pairs, not individual games. There may be some proxy numbers such as used game sales available somewhere.
In the original gameboy games, your character's default name is "Red" and your rival's default name is "Blue" - was the rival's name "Green" in Japan? Japanese for blue, "Ai", is a girl's name. If you bought Pokemon Blue was your name still "Red"? I should mention at this point that I've never actually played pokemon.
Conclusion

1 I made this up.
2 I don't remember where I read this and google search is destroyed by some singer who calls themselves "red russian"
3 They're both "ai", so is the japanese transcription of the english "I", this can lead to some complex pun layering
Comments

Jetz2015-05-26 16:14:30
Regarding the machinima, Blue team currently holds a massive lead in kill count - https://www.youtube.com/watch?v=78bsPOlbh3M&t=3m19s
You can add in the total kill counts of Agent Texas, who signed on with them temporarily, and Carolina, who is clearly wearing blue armor, and while the exact numbers may be a pain to compile, it'll definitely fall in favor of Blue team.
Bonus category: The word "Blue" appears 23 times in this article, while "Red" appears 30 times. A clear victory for team Red.
russian2015-05-29 07:37:50
In russian, the word 'blue' translates to two colors, 'normal' blue and 'light blue'. The 'light blue' one is a popular slang word for 'gay male'.
The word 'red' stems from the word 'pretty' in russian. ( - ). It's even used this way in old russian tales ( ) = pretty lady, literally 'red lady'.
The word 'red' stems from the word 'pretty' in russian. ( - ). It's even used this way in old russian tales ( ) = pretty lady, literally 'red lady'.
Really now?2015-05-29 07:38:52
Your system filters out non-english unicode from comments? That's just racist.
WHAT THE HELL?2015-06-06 11:39:27
SOME TIME, NO UPDATES, NOTHING AND YOU DO THIS???
Lord Tony2015-07-03 02:29:33
Red looks better by default though.
XR_72015-09-28 16:05:12
Excuse me but Home Depot is orange, not red. In fact, they paint their entire buildings in orange.
Isn't "aoi" Japanese for blue?
Badspot2015-10-26 04:39:34
I dunno. What do I look like, some kinda huge weeb?
Badspot2015-10-26 08:40:43
I looked into it some and I've determined that "ai" = indigo, and "ao" = blue. These are romanizations though, converted from the native moon runes. There is some flexibility/error in the conversion - google translate will convert both "aoi" and "ao" into the same moon rune meaning "blue", but converting english "blue" to japanese always gives you "ao".
There's also this mango https://en.wikipedia.org/wiki/Ai_Yori_Aoshi which I think was originally what I was thinking of instead of AI Love You. According to yahoo answers, it is part of a longer saying https://answers.yahoo.com/question/index?qid=20070806064218AAnYpxz
There's probably ai=love word play in there too, and the girl's name is Aoi - so maybe that does mean blue? The same kanji used for blue can also mean green as in inexperienced, so maybe there's something there too. Translating word play is difficult.
Also, indigo is a bullshit color. Real indigo is clearly just blue, and computer indigo is clearly just purple. https://en.wikipedia.org/wiki/Indigo
Chrono2016-01-12 12:34:04
"The sample size is huge - hundreds of thousands of games - so the advantage to the red team on certain maps is very real and unexplained."
Maybe blue players contrast more on those maps?
Maybe blue players contrast more on those maps?
Gothboy2016-01-23 07:06:37
Amazing research o.o